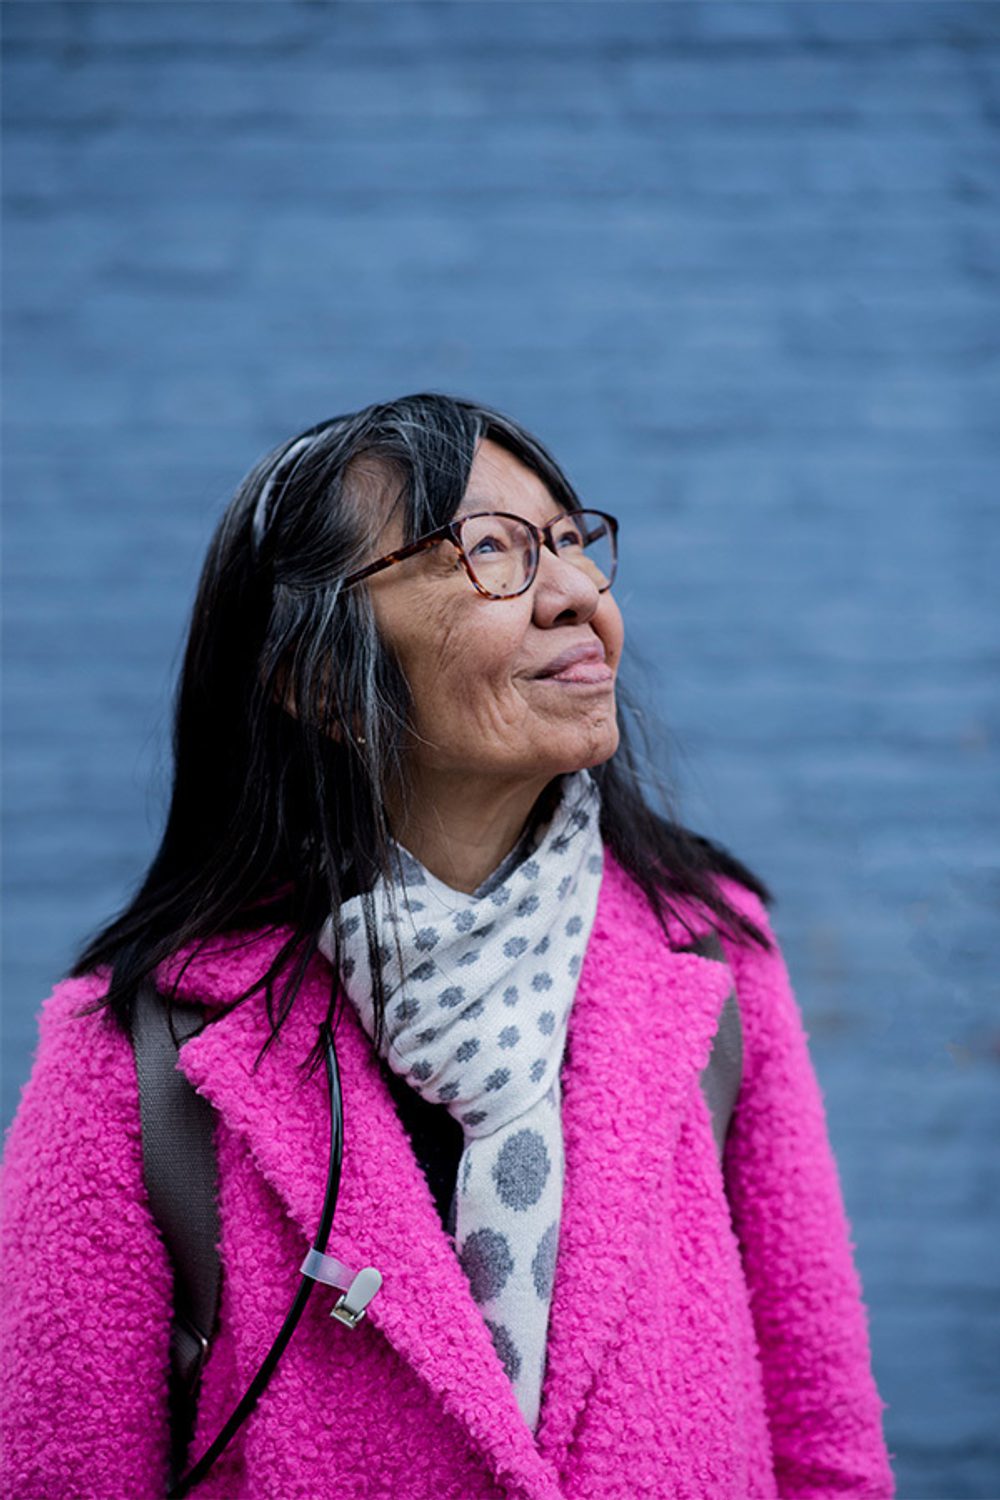
Do you know what’s in the #AirWeShare?
Air pollution is invisible but it’s in the air we breathe. In 2019, in partnership with King’s College London we gave 10 Londoners air quality monitors for a week, to track when and where people are most exposed to air pollution. The #AirWeShare campaign investigated how our daily actions affect our air pollution exposure and ways we can all reduce our exposure, cut pollution, and add our voices to the call for cleaner air.
The invisible issue
83% of us are worried about the effect of air pollution on our health, and our families' health (Hubbub, 2019). Many urban areas like London exceed World Health Organisation guidelines and legal limits for air quality. Yet being invisible, air pollution and its impact can be hard to grasp. Typical air quality monitoring stations give a good understanding of overall air pollution levels in towns and cities, but little is known about how much and where individuals are most exposed.
What we know about air pollution:
-
It affects our health:
in the UK, air pollution is the largest environmental risk to public health (PHE).
-
We’re all concerned about it, especially parents:
59% of parents said they would move house to escape air pollution if they could afford it and almost a third (31%) said that air pollution has been or will be a factor in deciding which school their child attends (Hubbub 2019).
-
It’s invisible and complicated:
making it hard for each of us to understand how and where we’re most exposed, how each of our actions contribute to air pollution, and the impact it has. For example, 70% of drivers are unaware they’re more exposed than pedestrians and cyclists (Hubbub 2019) and most people are unaware of the wider health impacts.
Understanding our exposure to air pollution
If we knew how our daily routines changed our exposure to air pollution, would we change our habits? We wanted to find out. In 2019, Hubbub worked with 10 Londoners who carried portable air quality monitors for a week. The monitors, provided by Kings College London, tracked black carbon - which is most likely to be from traffic. From a school pupil to a city cyclist, HGV driver and retired librarian, all had very different lives and routines to help compare where and when people are most exposed to air pollution. We found exposure varied a lot.
- The HGV driver had the highest overall exposure to poor air, due to sitting in traffic. Those that walked and cycled had the least exposure, especially if travelling on quieter roads.
- Poor air quality is very localised. Choosing less busy routes when walking or cycling reduces exposure by a lot. One cyclist reduced exposure to poor air quality by 50%.
- Modern office buildings with efficient filter systems tend to have good air quality compared to leakier older buildings, or ones next to busy roads.
- Burning anything drastically reduces the quality of air. The monitoring could detect when people had lit candles, incense sticks or fires in their homes as there was a spike in poor air quality levels.
To help raise awareness about air quality, we wanted to help the public engage with live air pollution data, so we commissioned a high-profile, 10 day installation in January 2020, in Covent Garden called the ‘Pollution Pavillion’. It used huge balloons that changed colour to reflect levels of Nitrogen Dioxide (NO2) using data from 5 air quality sites in London.
What difference did we make?
Those that took part were inspired to change their habits and routines and share their experiences with others. Reuben, a primary school pupil said “People should know which roads are the best to walk down, and which ones have bad air. I’m going to always walk through the park when I go to school, as far away from cars as possible.”
A set of five recommendations were pulled together off the back of the research, for businesses, local authorities and organisations looking to engage with the public on the issue. Karen Buck MP for Westminster North, participated in the monitoring and co-hosted an All-Party Parliamentary Group, presenting the findings to 50 attendees.
The research findings and personal stories were published with The Times as part of their ‘Clean Air For All campaign’, offering 6 million opportunities for people to learn more about how different daily habits lead to different exposures to air pollution. Jeremy Vine, who took part in the monitoring, also shared the results across his Channel 5 show.
The ‘Pollution Pavillion’ offered passersby an opportunity to experiment with different scenarios and learn how habits change their exposure. We reached 1.6 million people and 20,000 people engaged with the research.
How we can all improve the #AirWeShare
- Make some small switches to improve the #AirWeShare.
- Make your voice heard. Air your thoughts on the (social media) air waves and tell your friends and family what you think about pollution in the #AirWeShare. Join a local group campaigning for change, and download this editable letter to your local MP, and ask them what they’re doing to clean up our air.

Want to stay in the loop?
Sign up to our newsletters to be the first to know about new campaigns, launches, inspiration, research and environmental news. You’re in for a treat.


